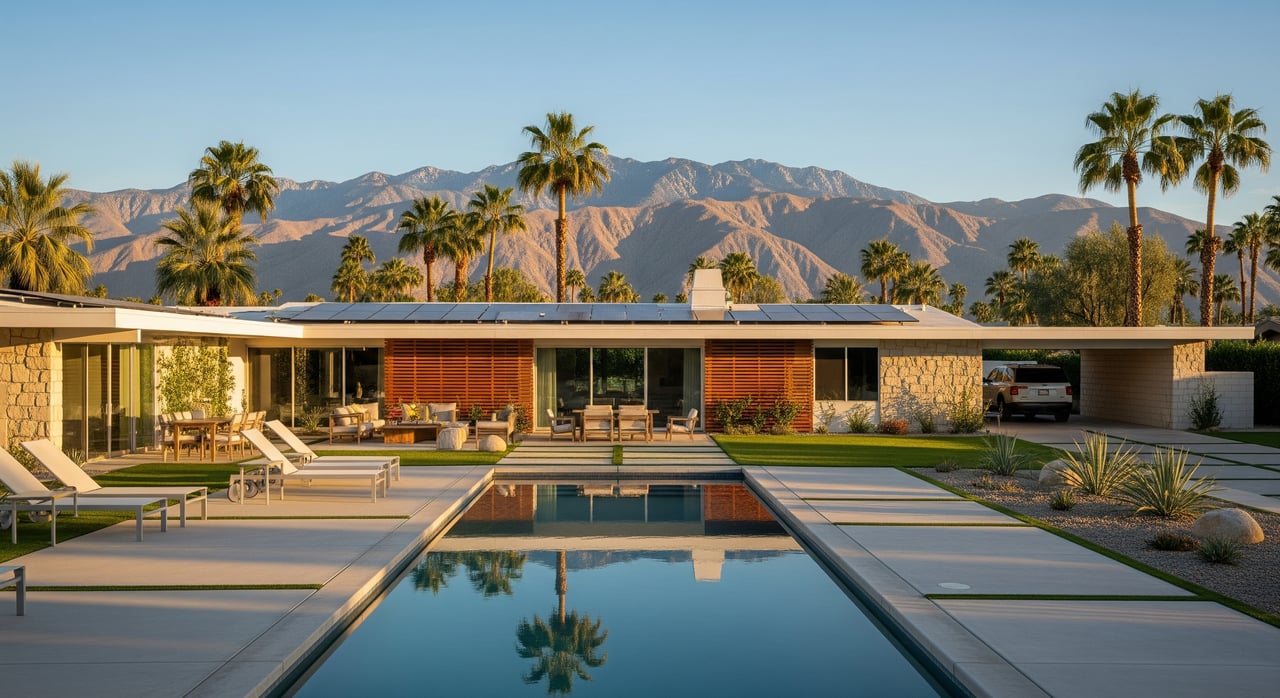
Coachella Valley Housing Update — October 2025: Prices Holding Firm, Market Finding Balance
Market Update Andrew Shouse November 10, 2025
Market Update Andrew Shouse November 10, 2025
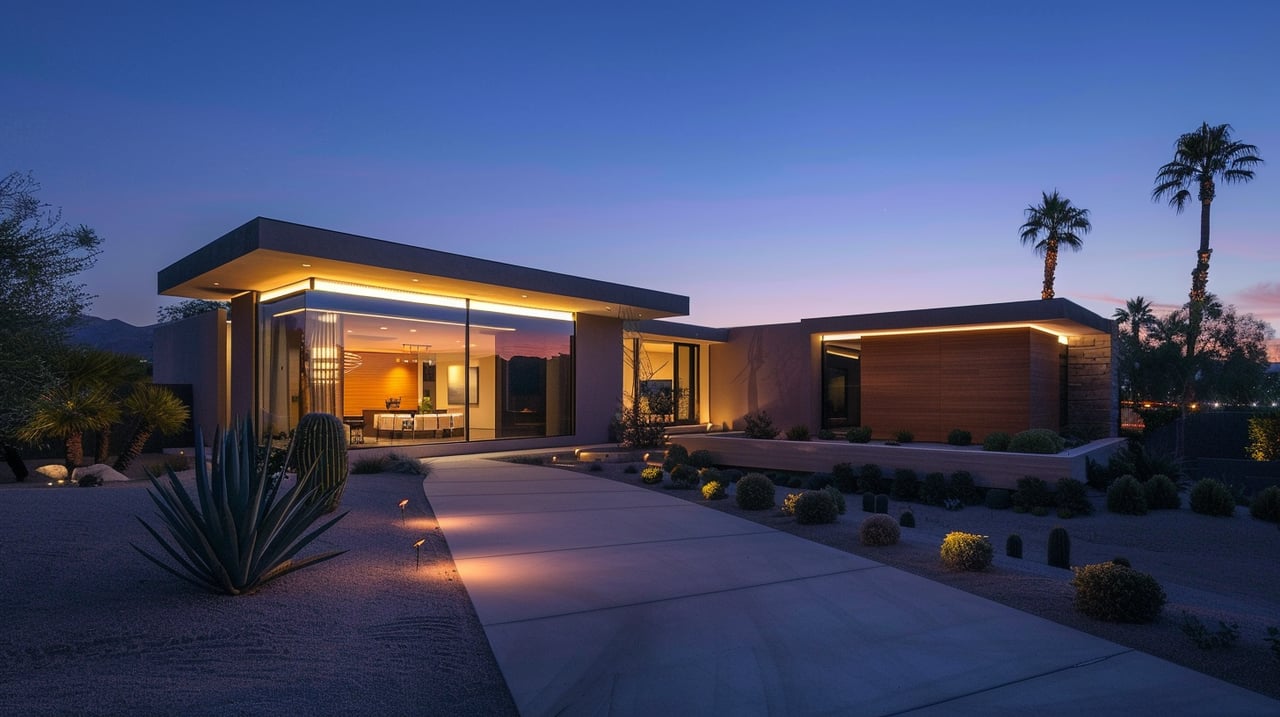
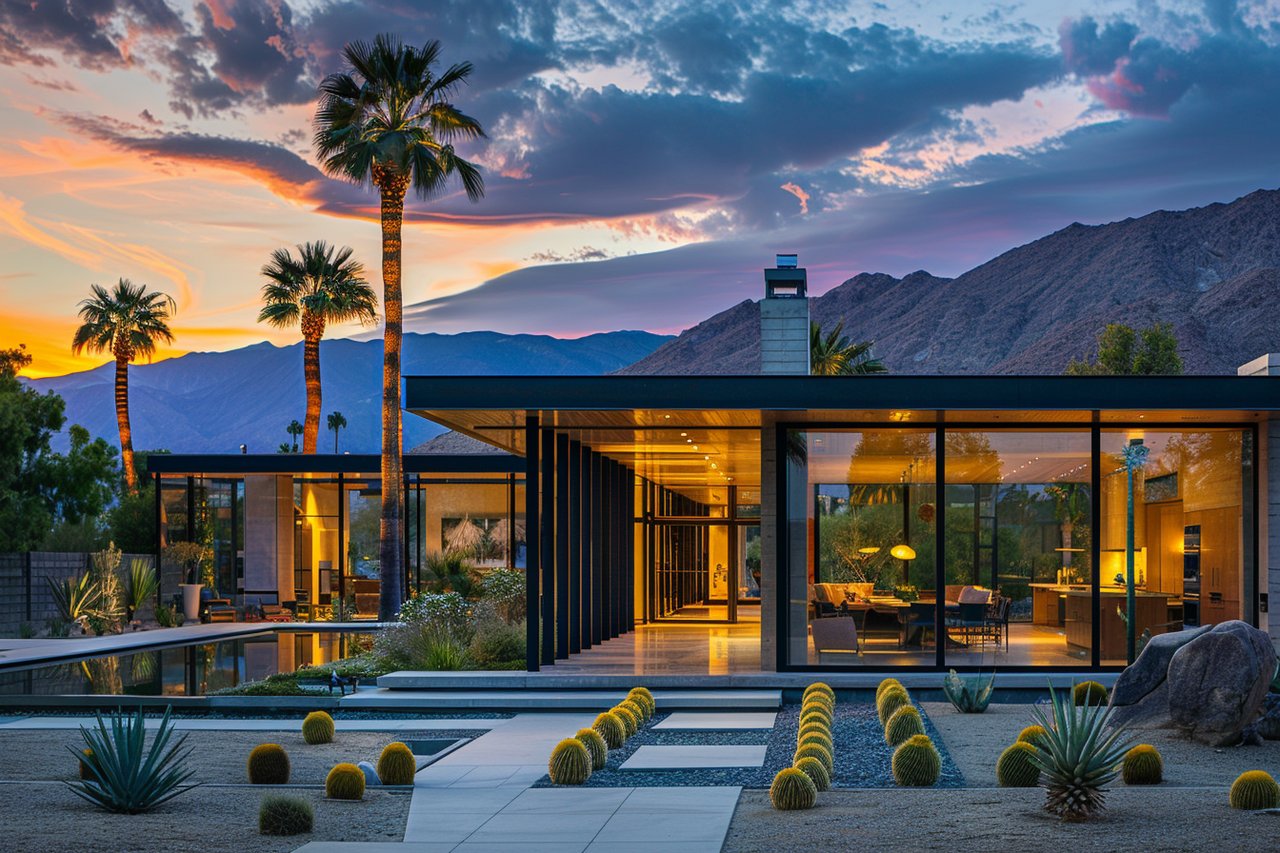
After three years of pandemic whiplash, the desert’s housing market is settling into a steady rhythm — and that’s good news for both buyers and sellers.
(Source: GPSR Desert Housing Report, released Nov 4, 2025)
Detached median: $625,000 (–1.6% YoY | –11.7% from 2022 high)
Attached median: $420,000 (–2.2% YoY | –13.9% from 2022 high)
Sales (3-month avg): 543 units (+11.1% YoY)
Dollar volume: $432 million (+18.7% YoY)
Inventory: 3,233 homes (+14.5% YoY)
Months of Sales: 5.2 months (vs 4.6 last year) — edging toward balance
Median Days on Market (DOM): 59 days (+13 days YoY)
% of homes selling > list: 12.3% (vs 14.5% last year)
The post-COVID premium is fading, but not crashing. With detached prices only 11–12% off 2022 peaks, the Valley remains one of the most resilient resort markets in California.
Homes priced correctly — in clean $25K bands — are still moving in under 60 days.
Overpricing is punished: listings sitting 75+ days are typically 3–5% over market.
Expect appraisers and buyers to anchor offers to 2022 highs minus 10–15%.
Inventory is up, competition is down, and discounts have returned.
The average home now sells 2–4% below list, giving buyers room to negotiate.
With MoS above 5 months, buyers can shop without pressure — a rare treat in the desert.
For second-home buyers and investors, this is a window of relative affordability before the winter influx.
| City | Avg. Home Price (Detached) | YoY Change | % from 2022 High |
|---|---|---|---|
| Cathedral City | $566,199 | +2.2% | –8.1% |
| Palm Desert | $712,381 | +1.6% | –11.7% |
| Rancho Mirage | $1,359,157 | –0.9% | –7.1% |
| Indio | $612,946 | –1.8% | –7.3% |
| Coachella | $472,575 | –2.3% | –4.4% |
| La Quinta | $794,026 | –3.4% | –13.0% |
| Desert Hot Springs | $410,656 | –3.5% | –3.5% |
| Palm Springs | $1,081,342 | –4.0% | –23.7% |
| Bermuda Dunes | $659,528 | –8.0% | –20.3% |
| Indian Wells | $1,756,944 | –16.5% | –13.9% |
💡 Prices remain within 10–15% of 2022 highs in most cities, signaling stability after a healthy correction.
For Sellers:
Price to the current comp — not the memory of 2022.
Use round numbers: e.g., $775K or $800K (never $799K).
Refresh listing photos; fall light makes desert homes glow.
Offer small credits (closing costs, rate buy-downs) to stand out.
Expect 60 days to sell if priced right.
For Buyers:
Use the 5.2 MoS metric as leverage — it’s a balanced market, not a seller’s one.
Lock rate, then negotiate for credits or furniture.
Focus on quality: La Quinta and Palm Desert now offer mid-range luxury at 2021 prices.
Palm Springs: Still leads in dollar volume ($94 M/mo), but down ~24% from 2022 highs.
La Quinta: Down 13% from 2022 highs — strong golf-season bounce expected.
Cathedral City: The quiet winner — +2.2% YoY with fastest DOM (47 days).
Because that’s when the market topped. Comparing to that benchmark gives a realistic sense of “giveback” after pandemic peaks. Most desert cities have adjusted 10–15%, aligning prices with long-term affordability and steady demand.
Ready to see how your home’s value stacks up in the post-pandemic market?
👉 Request a Free Micro-CMA
Stay up to date on the latest real estate trends.
Market Update
Weekly Newsletter
Market Update
Market Update
Market Update
Opportunities in 2025